We already got stock GDB into decent shape. Now lets make it zero cool.
Everything above makes stock GDB tolerable. pwndbg makes it a different tool. It is a Python extension that rebuilds the interface around what you actually want on every stop. Registers, disassembly, stack and backtrace, printed automatically. It also adds a pile of commands GDB has no answer for.
Install it into a directory you keep, because you will be pointing your
.gdbinit at it:
$ git clone https://github.com/pwndbg/pwndbg ~/tools/pwndbg
$ cd ~/tools/pwndbg
$ ./setup.sh
setup.sh pulls the Python dependencies and appends one line to your
~/.gdbinit:
source ~/tools/pwndbg/gdbinit.pyWhat you get
The main feature is context. Stop anywhere and pwndbg prints registers, the
next instructions, the source, the stack and the call chain in one screen, with
pointers followed. You stop typing info registers, x/16gx $rsp and bt
after every step.
This is the same break check / run Evan from the first lesson, with pwndbg
loaded:
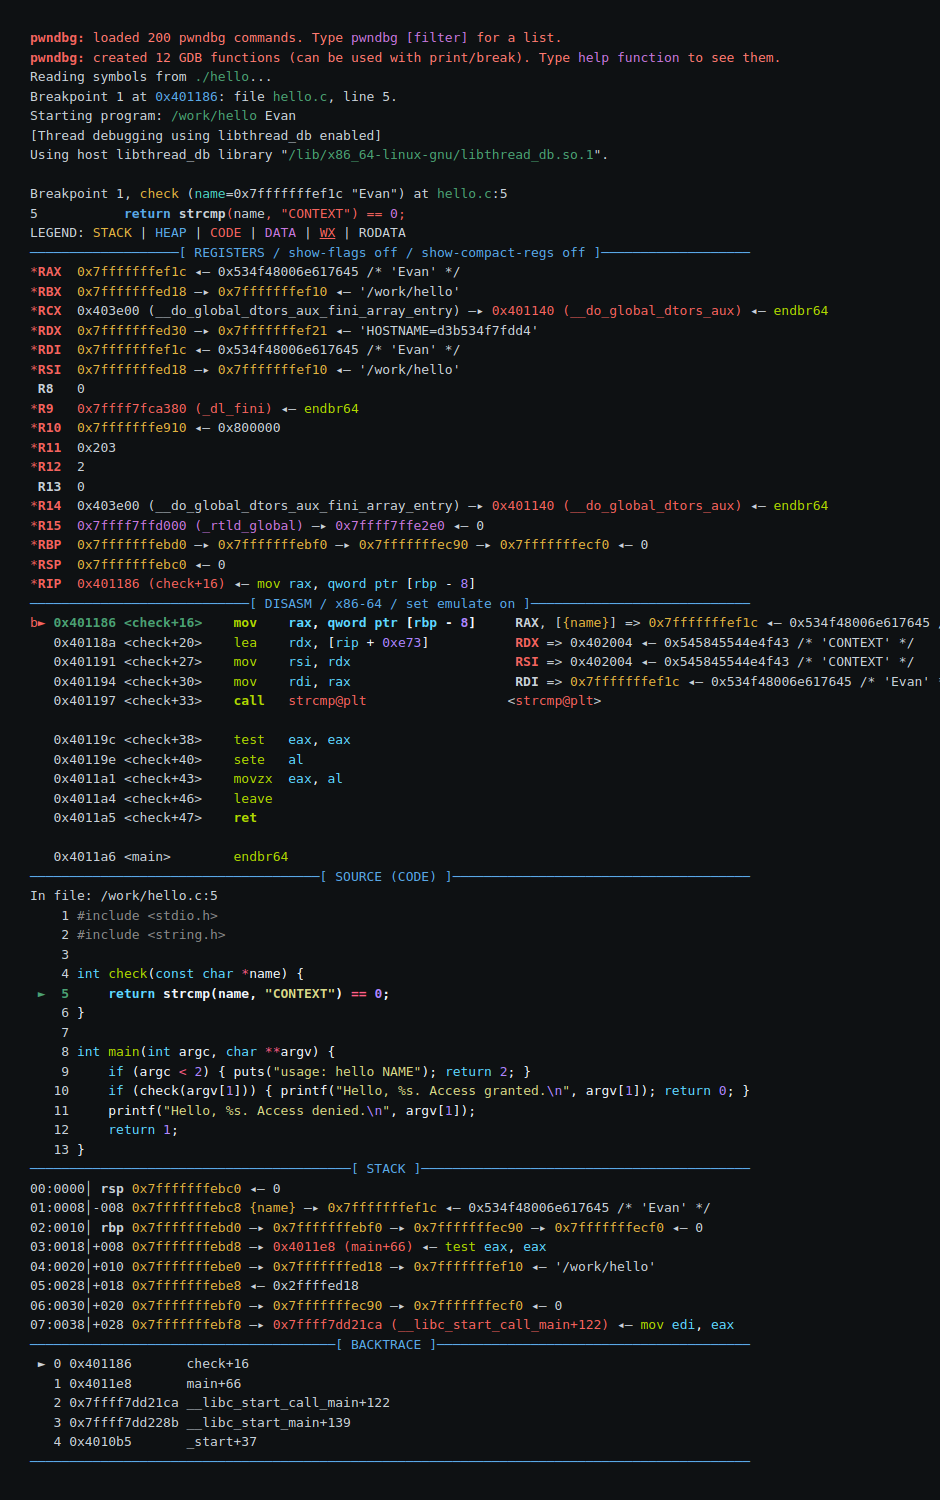
The LEGEND line at the top is the key:
yellow is stack, blue is heap, red is code, purple is data. A register full
of yellow is a pointer into the stack. A register full of red is a function
pointer. You read the process state at a glance instead of chasing each value
with x/.
Notice *RDI 0x7fffffffef1c ← 0x534f48006e617645 /* 'Evan' */. It followed the
pointer and told you the argument is the string you passed. That is three
commands in stock GDB, on every stop.
The commands worth knowing on day one:
| Command | What it answers |
|---|---|
context |
Reprint the full picture. context regs, context stack for one pane |
vmmap |
What is mapped where, with permissions. The map GDB never shows you |
telescope <addr> |
Follow a chain of pointers and label what each one lands in |
hexdump <addr> |
Annotated hex, rather than counting x/ format letters |
search <pattern> |
Find a string or value anywhere in the address space |
checksec |
NX, PIE, RELRO, canaries. The mitigations in force |
piebase |
The runtime load base of a PIE binary |
cyclic 200 / cyclic -l |
De Bruijn pattern, and the offset a crash landed at |
heap, bins |
glibc allocator state, chunk by chunk |
vmmap and piebase hand you the module base instead of making you dig out of
info proc mappings before add-symbol-file will work. And checksec answers
“what am I even up against” before you spend an hour on a mitigation that was
never enabled.
Tuning it
pwndbg has its own config system, config to list and set to change:
# Which panes appear, and in what order.
set context-sections regs disasm code stack backtrace

# It prints a lot. Trim it on a small terminal.
set context-max-lines 8
set context-stack-lines 6

# Persist what you have changed.
configfile   # writes ~/.config/pwndbg/config.py
themefile    # writes the colour theme separately
theme lists the colour knobs, and everything is separately overridable. That
matters if you work on a light terminal, because the defaults assume a dark
one.
Further investigation
We didn’t even scratch the surface on what pwndbg enables make sure you check
out the docs
If pwndbg isn’t your thing there are options. gef and gdb-dashboard do
the similar with different opinions. They are all worth exploring in your
debugging journey.
Up next
That is the course. You can start a program under GDB or attach to one that is already running, explain what the debugger did to it to make that possible, make custom functions, and read the whole process state on one screen.